IVRE
Network cartography, searchable scan history, consolidated host views and flow analysis. Its Python API connects the results to further visualisation.
Project overview ↗ · Data model ↗JAMES TERVIT / NETWORK OBSERVATION & FORENSICS
Collect observations. Join the data points. Follow the connections through time. James’s network work grew into a forensic question: how do you build a useful picture from a very large amount of changing information?
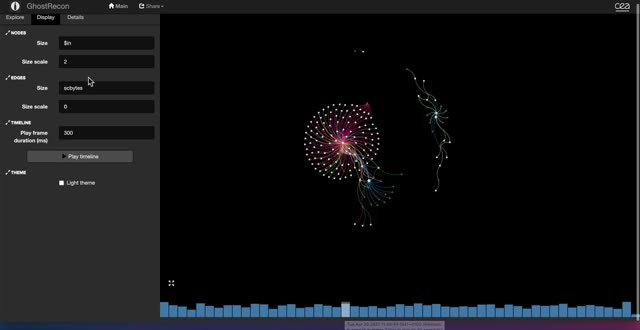
An actual frame from James’s supplied PXC graph-review recording · filename dated 21 April 2021.
THE CONNECTION / JAMES’S ACCOUNT
James describes Atamli’s approach as an influence on his continuing forensics work with IVRE, Nmap and related collection tools. The aim was to gather many observations quickly, search for exposed services and information, and replay the relationships so an investigator could see how activity developed.
His 17 November 2021 NVIDIA comment records out-of-band and wireline-fingerprinting experiments and interest in BlueField. Host-memory introspection and network cartography provide different evidence: one examines runtime state; the other organises what is observed across addresses, services and flows.
James dates the wider experiments to circa 2015–2019, ETS2 face tracking to 2015 and the four-screen demo to 2016. Mobile TensorFlow followed in 2020 during Covid, while he was recovering from a major loss. Later filenames and published research dates remain separate reference points. James’s account describes the influence; the recordings and public comment provide dated reference points without establishing a single start date or a research collaboration.
OBSERVATION → INVESTIGATION
Active observations from Nmap and complementary collectors; passive network records from traffic-analysis tools.
IVRE stores observations and combines host information, keeping scan records and flow data available for analysis.
Filter by service, network, time or address. Compare observations and inspect what was exposed at the time recorded.
James’s PXC graph-review recording shows a timeline interface for exploring connections. Playback helps communicate the changing relationships.
The videos below are recordings of the work. This page does not start a scan or claim to provide a live view of today’s internet.
THE TOOLS / ORIGINAL REFERENCES
Network cartography, searchable scan history, consolidated host views and flow analysis. Its Python API connects the results to further visualisation.
Project overview ↗ · Data model ↗Host discovery and service characterisation: useful detail about what is reachable and how it responds.
Original reference guide ↗Complementary collection of reachability, application-layer and DNS observations. These are different stages of measurement, rather than interchangeable answers.
Masscan ↗ · ZGrab2 ↗ · ZDNS ↗Passive observations and flow records help add the communication history behind a host or service.
IVRE’s supported flow inputs ↗Python plots, maps and relationship views help make the accumulated data understandable. James’s recordings show several different visual techniques.
Matplotlib ↗Atamli’s work provides the separate host-observation perspective that James followed. The research notes explain its trust assumptions and limits.
Read the local source notes →THE LOCAL RECORD / 12 FILMS
Original recordings, served locally. The archive spans forensic graph playback, metrics, routing, remote desktops and related vision experiments. Each player keeps the supplied resolution and loads video only when requested.
Forensic replay / Circa 2015–2019 · James’s account
Loading the local player…
A GhostRecon graph view with nodes, edges and a playback timeline. James places the underlying work within his circa 2015–2019 experiments; the preserved filename carries the later date 21 April 2021.
Forensic replay / Circa 2015–2019 · James’s account
Loading the local player…
The supplied PXC / Jetson presentation connects tracking, aggregation and time alignment. Its title refers to an atomic-adjusted clock; no timing accuracy is inferred.
Forensic replay / Circa 2015–2019 · James’s account
Loading the local player…
Network receive/transmit charts and operational metrics: the supporting view of how data moves through the system.
Visualisation / Reference used in the 2015–2019 period
Loading the local player…
Animated IVRE project history, including Pierre Lalet’s name on screen. The displayed dates refer to the visualised history, not a verified recording date. This is not a live host-exposure map.
Networking / Circa 2015–2019 · James’s account
Loading the local player…
A local recording of virtual-network membership, interfaces and route experiments. Preserved as the network-engineering context for the security work.
Networking / Circa 2015–2019 · James’s account
Loading the local player…
A VPP virtual-machine build workflow and terminal, illustrating the network-engineering work James places around 2015–2019. The preserved filename is dated 28 April 2021.
Networking / Circa 2015–2019 · James’s account
Loading the local player…
James’s supplied compression demonstration, retained at its original 530 × 360 resolution. No throughput benchmark is asserted.
Networking / Circa 2015–2019 · James’s account
Loading the local player…
The supplied desktop-infrastructure comparison, alongside the routing and forensic visualisation recordings.
Networking / Later recording · earlier work context
Loading the local player…
A later macOS Big Sur / Ubuntu remote-viewer recording illustrating the working environment around James’s network experiments, rooted in his circa 2015–2019 work. The exact capture date is unverified.
Visualisation / 2020 · confirmed by James
Loading the local player…
Mobile TensorFlow object detection in 2020, during Covid while James was recovering from a major loss. The preserved filename carries the later date 7 April 2021. A computer-vision experiment alongside his networking work.
Visualisation / 2016 · confirmed by James
Loading the local player…
James’s four-screen demonstration from 2016. Preserved at its supplied 320 × 180 resolution, without upscaling.
Visualisation / 2015 · confirmed by James
Loading the local player…
ETS2 face tracking with a camera in 2015, as confirmed by James: an early experiment in using movement to control a visual interface.
Imported 27 September 2026 from James’s supplied files. Original files remain unchanged. Playback copies preserve the H.264/AAC streams and place MP4 metadata at the beginning for faster start-up; no upscaling or video re-encoding. One identical QAT duplicate is represented by a single player.
Source dates from filenames are labelled as such. “Wire Frame” shows animated IVRE project history with Pierre Lalet named on screen; it is kept as a visual reference, not presented as James’s live internet scan. The other titles describe the supplied recordings and are not independent performance measurements.